data design
When it comes to collecting and showcasing data, we’re passionate about demystifying technical subjects and making them more accessible to a wider audience. We can help you achieve maximum impact with our:
- engaging data visualisations
- attractive infographics
- research posters that pop
- easy-to-use back-end web developments to collect and organise data
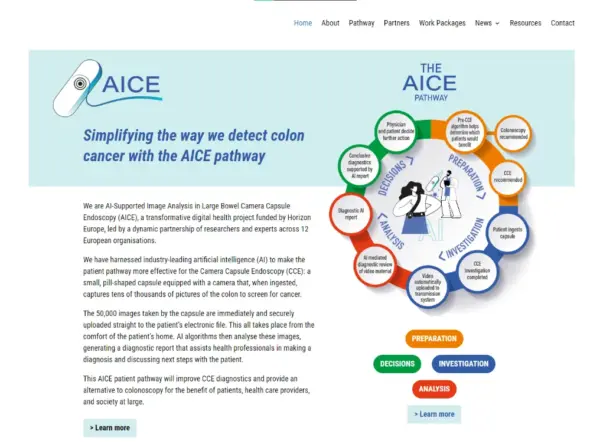
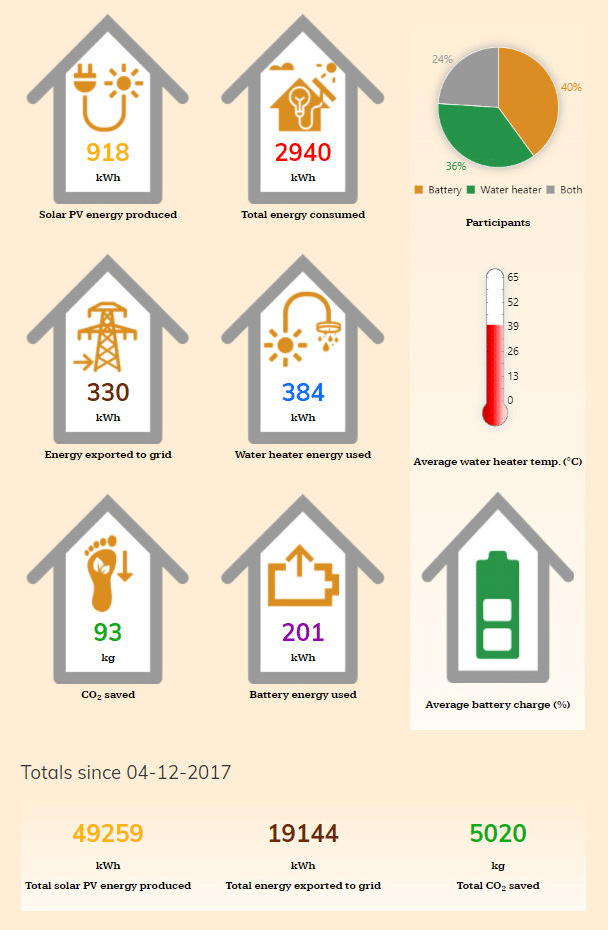
We can make data come alive
You can take your tables and graphs to the next level. Project Sensible, a pan-European community energy project, needed to demonstrate the amount of energy and CO2 emissions saved. Accessible graphs and charts and custom-made icons connected to live project data and demonstrate impact in an accessible way. Our custom web developments can make a targeted impact with stakeholders.
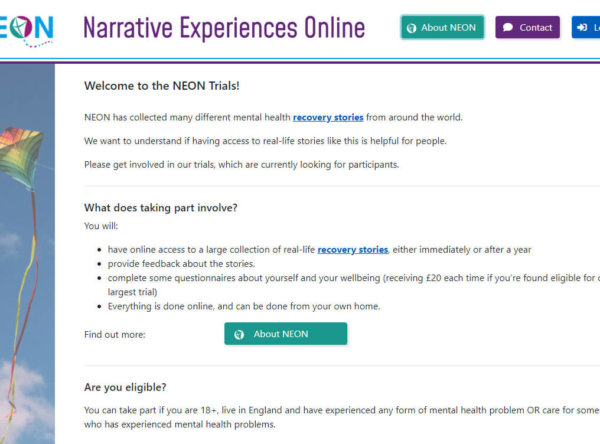
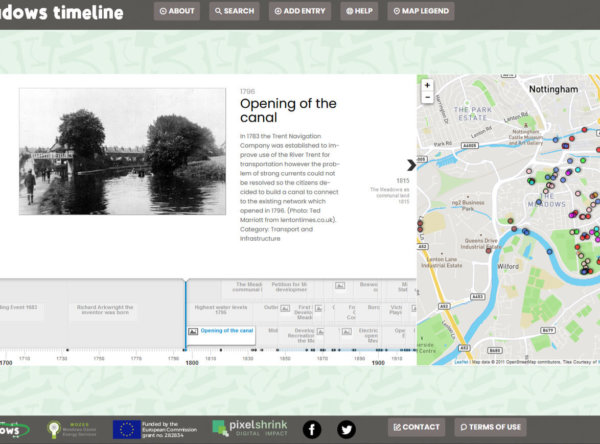
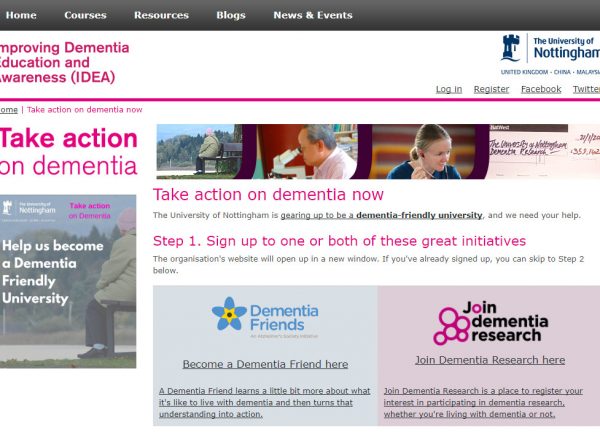
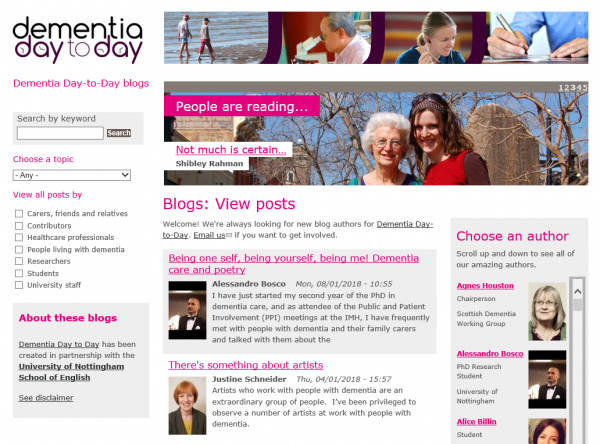
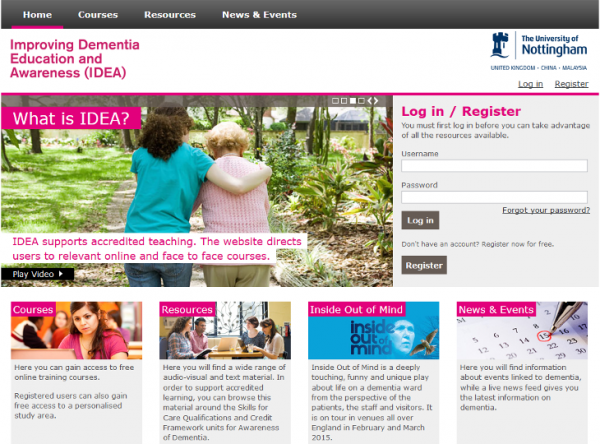
Don’t forget about the backend
It’s so easy to forget that collecting and administering your data needs to be as user-friendly and intuitive as presenting it. We’ve created clever blogging platforms, and special forms that help organisations offer a complex product offering, or run an online campaign. We’ve also set up a customised online mapping application for a local sustainability project.
Contact us today to discuss your needs and see how we can maximise your impact.